Lab 01: Honeycomb Compression Test
AE 417 · Aerospace Structures and Instrumentation Laboratory · Fall 2025 · ERAU
Experiment Overview
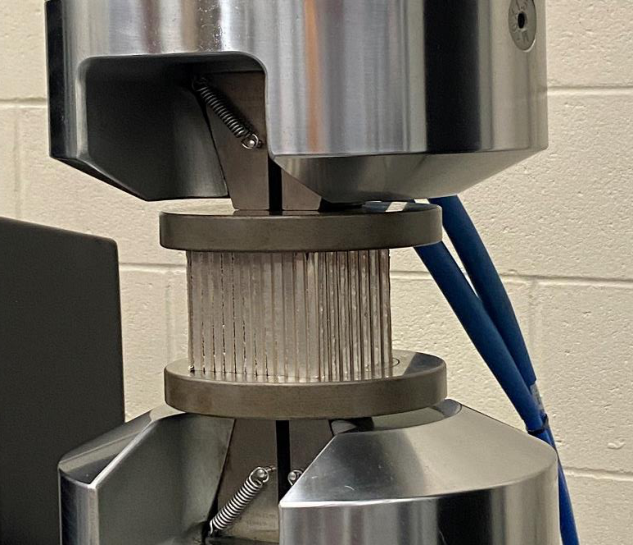
Aluminum honeycomb core is one of the most weight-efficient structural materials in aerospace. It fills the interior of aircraft floor panels, fairings, and control surfaces, absorbing crash energy and carrying compressive loads at a fraction of the weight of solid metal. This lab tested an aluminum honeycomb specimen in out-of-plane compression per ASTM D 7336/D 7336M-07, characterizing its three-stage crushing behavior and comparing results against manufacturer specifications for the 5056 alloy series.
- Measure the out-of-plane compressive behavior of an aluminum honeycomb core following ASTM D 7336
- Identify the three crush stages: initial linear elastic loading, progressive cell-wall buckling plateau, and final densification
- Extract peak stress σpeak, crush stress σcrush, and total energy absorbed from the stress-strain curve
- Examine post-crush cell wall morphology under microscopy to confirm the buckling mechanism
Equipment & Tools
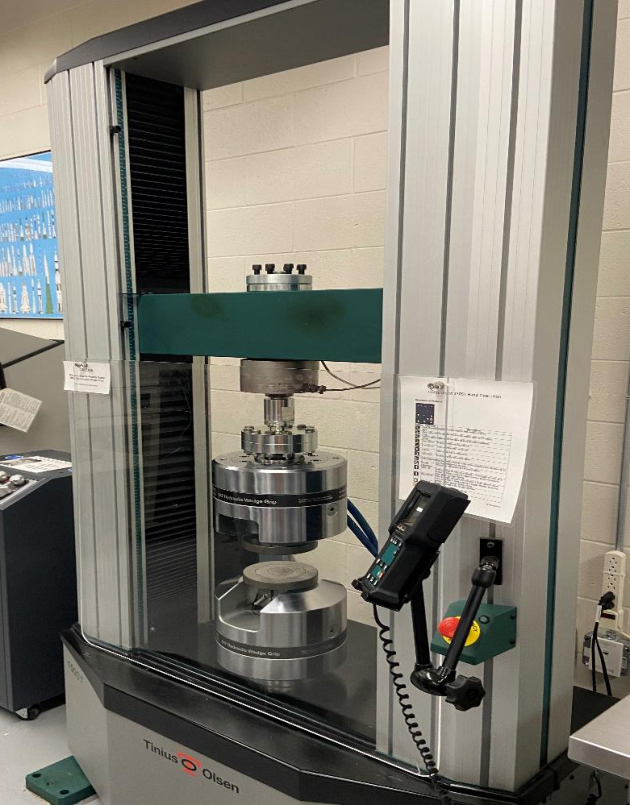
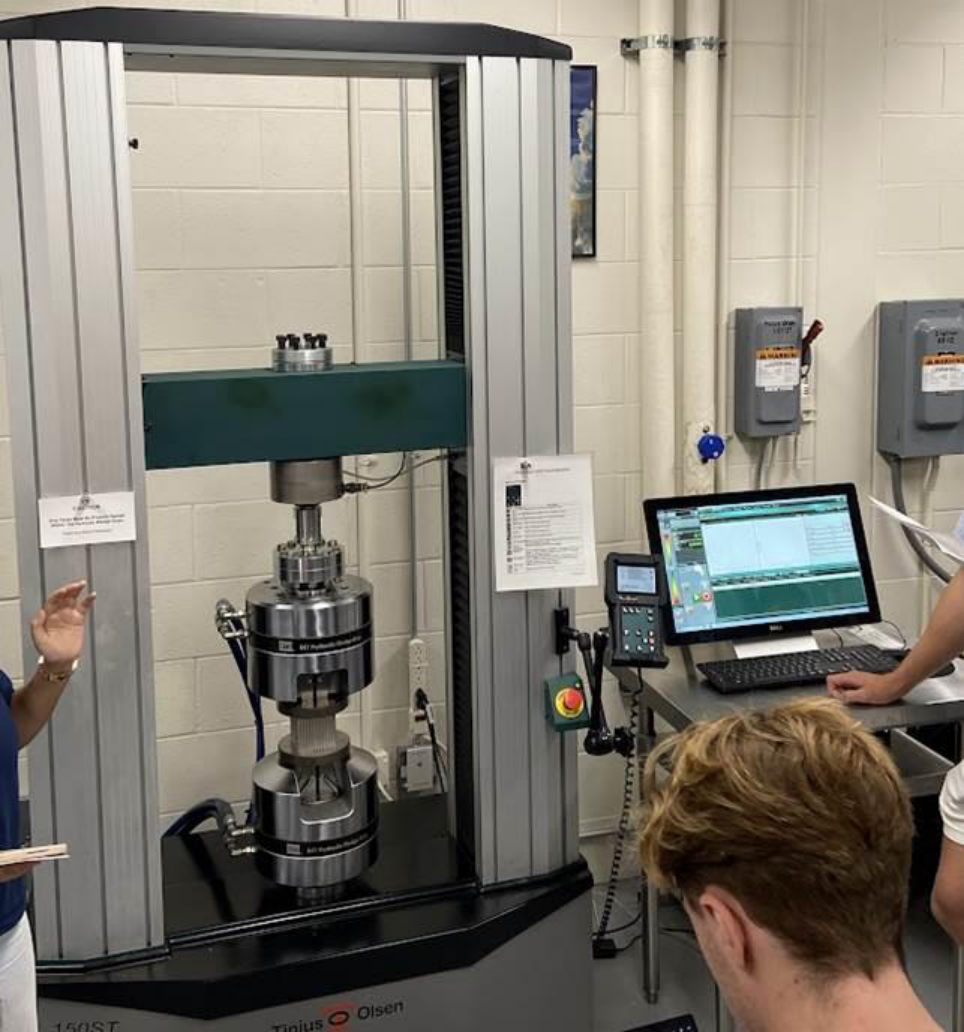
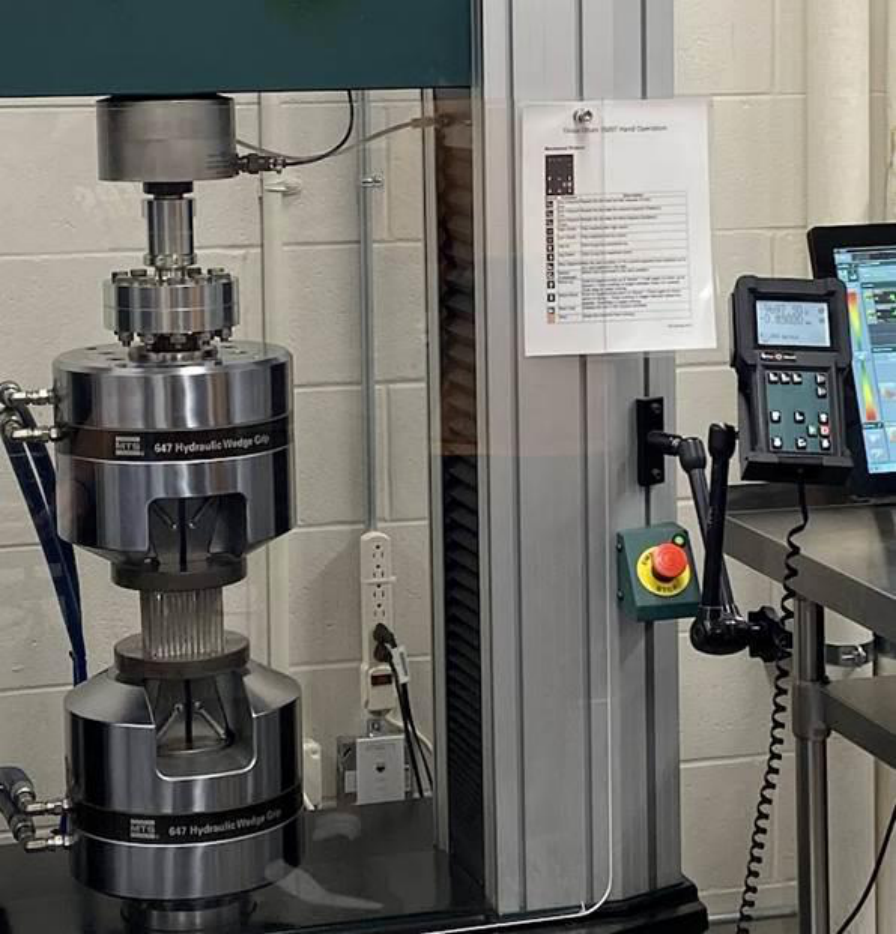
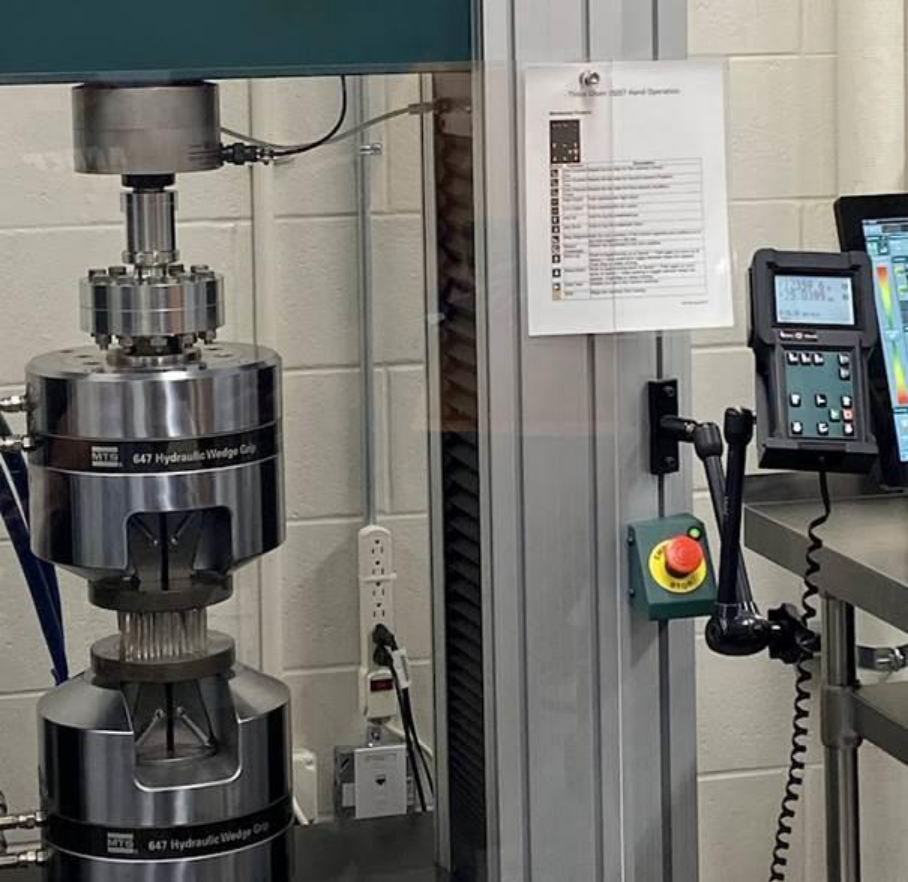
- Tinius Olsen 150ST Electromechanical Universal Testing Machine with compression plates
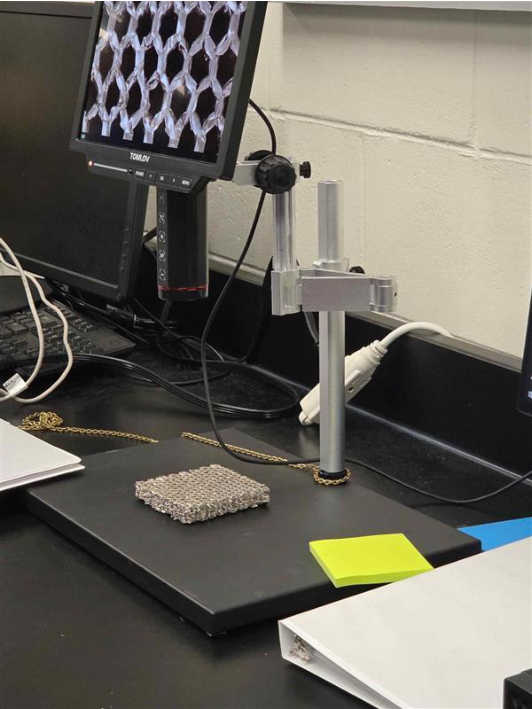
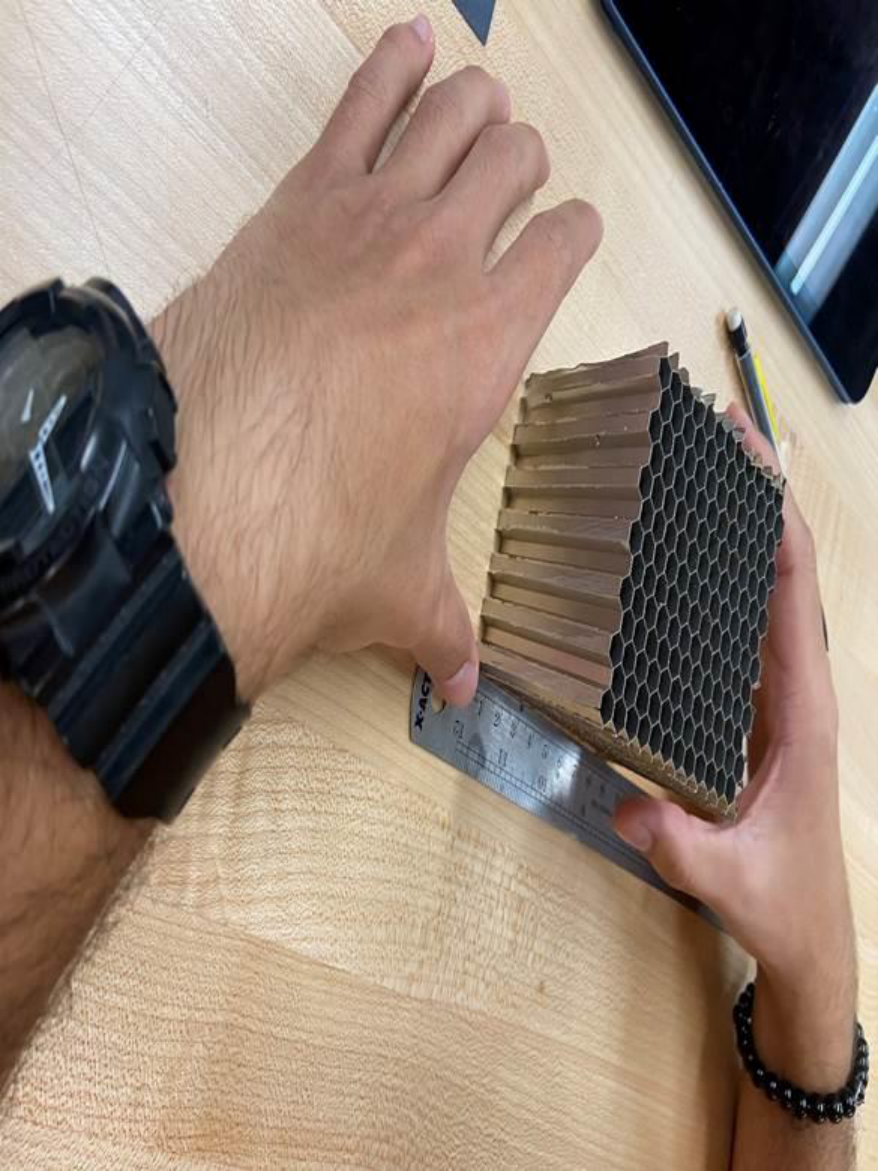
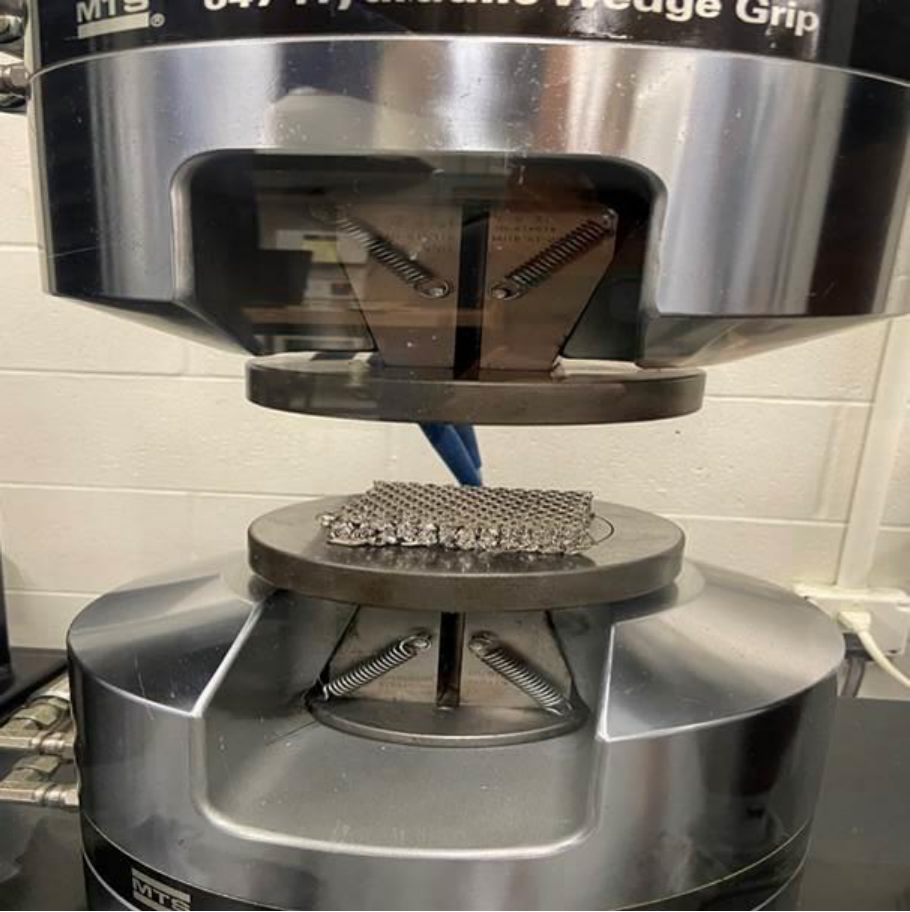
- Aluminum honeycomb specimen (~80×80×75 mm, 5056 alloy, cell size ≈6.11 mm)
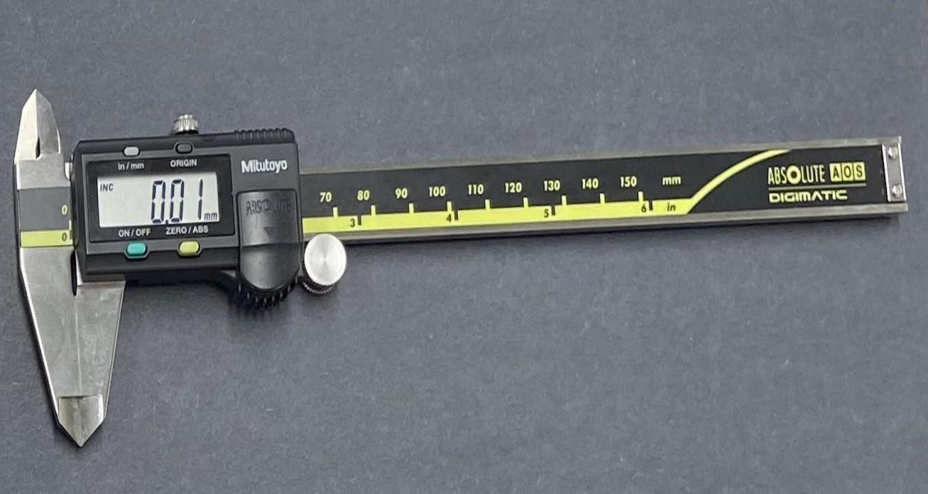
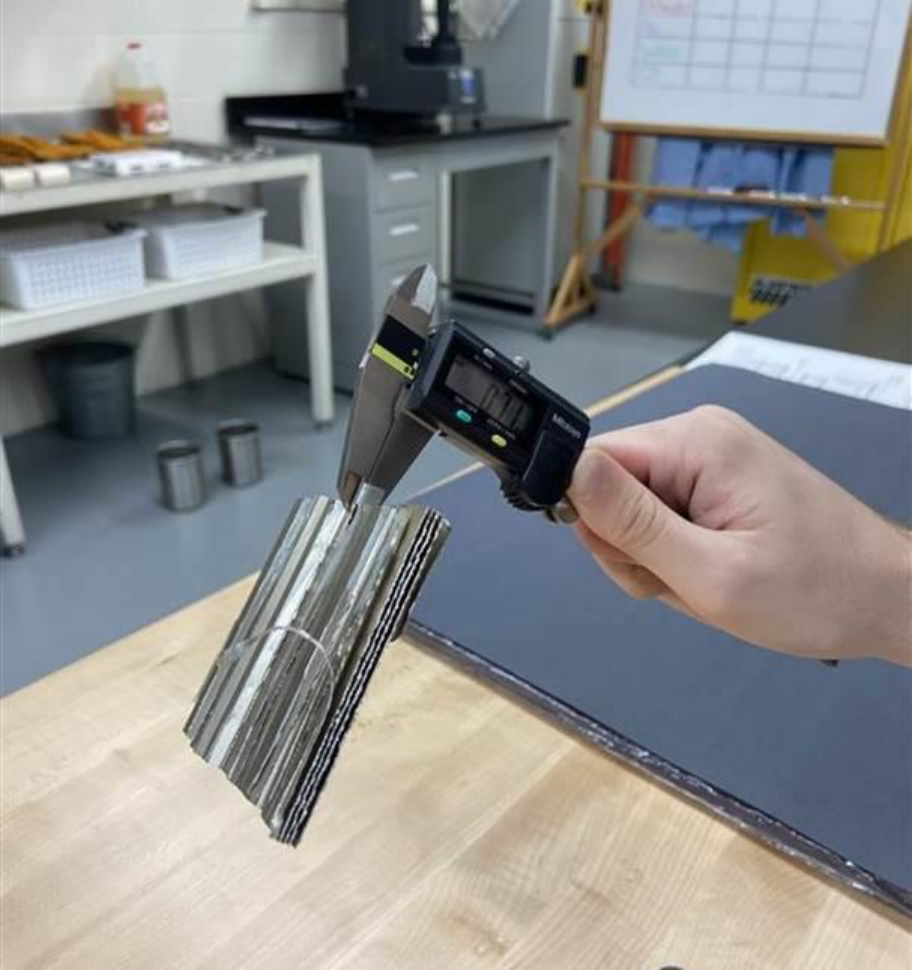
- Mitutoyo digital calipers (foil thickness, cell size, outer dimensions)
- Ohaus Scout precision mass scale
- Motic stereo zoom microscope with digital camera, WhiBal card, and imaging software
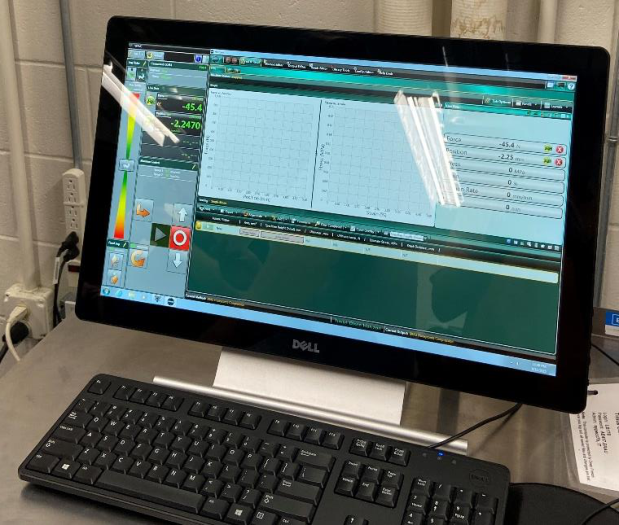
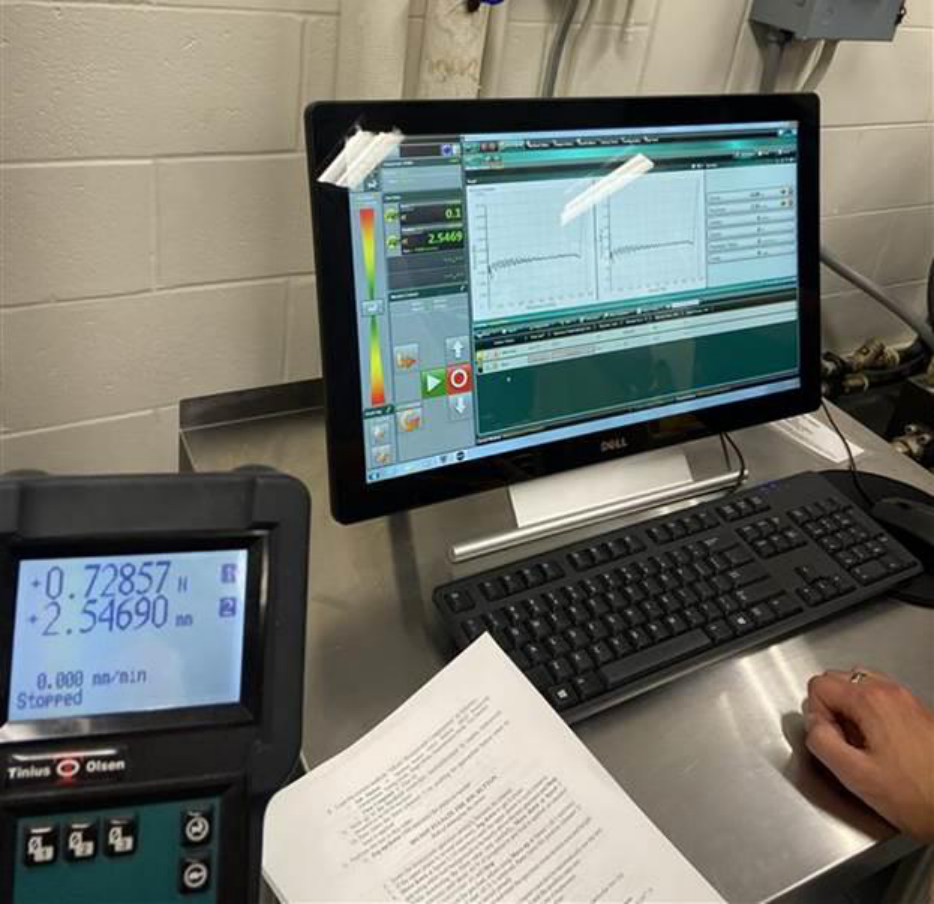
- Computer with Tinius Olsen data acquisition software
Approach
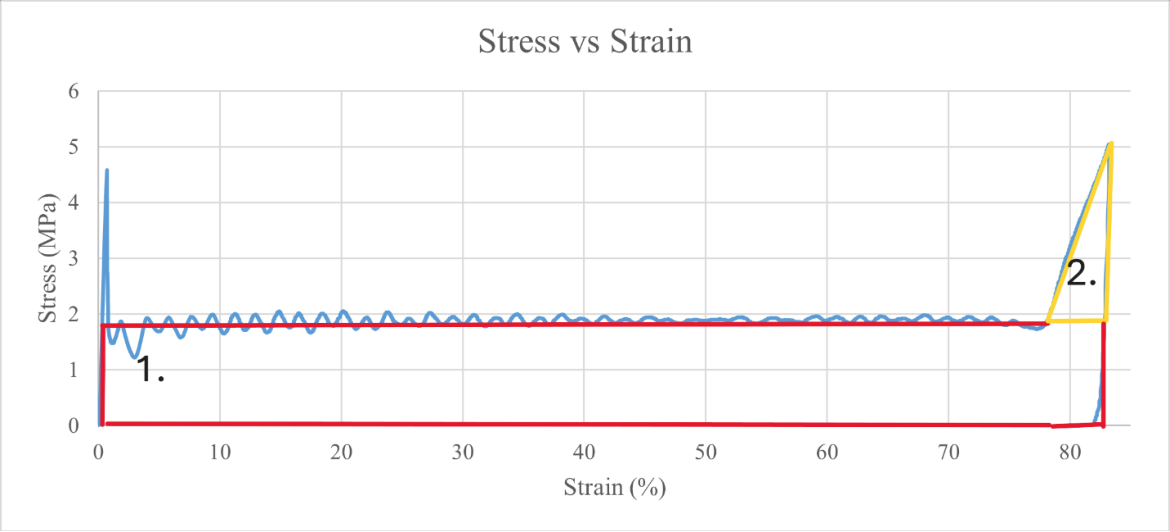
Four teams each measured five nominally identical specimens, recording foil thickness, cell size, dimensions, and mass. The specimen closest to the cross-team mean was selected for compression testing to minimize variability. The Tinius Olsen 150ST applied an axial load at constant displacement rate using the “ERAU Honeycomb Compression” test method, recording force and displacement throughout the crush cycle. Stress was computed by dividing force by the measured cross-sectional area, and strain by dividing displacement by original height. Energy absorbed was calculated as the area under the stress-strain curve, computed analytically by breaking the curve into two geometric regions. Post-test microscopy documented cell wall buckling morphology at multiple magnifications.
Key Results
- The force-displacement curve showed all three expected stages: a steep linear rise, a buckling plateau at near-constant load, and a sharp densification spike at the end of travel.
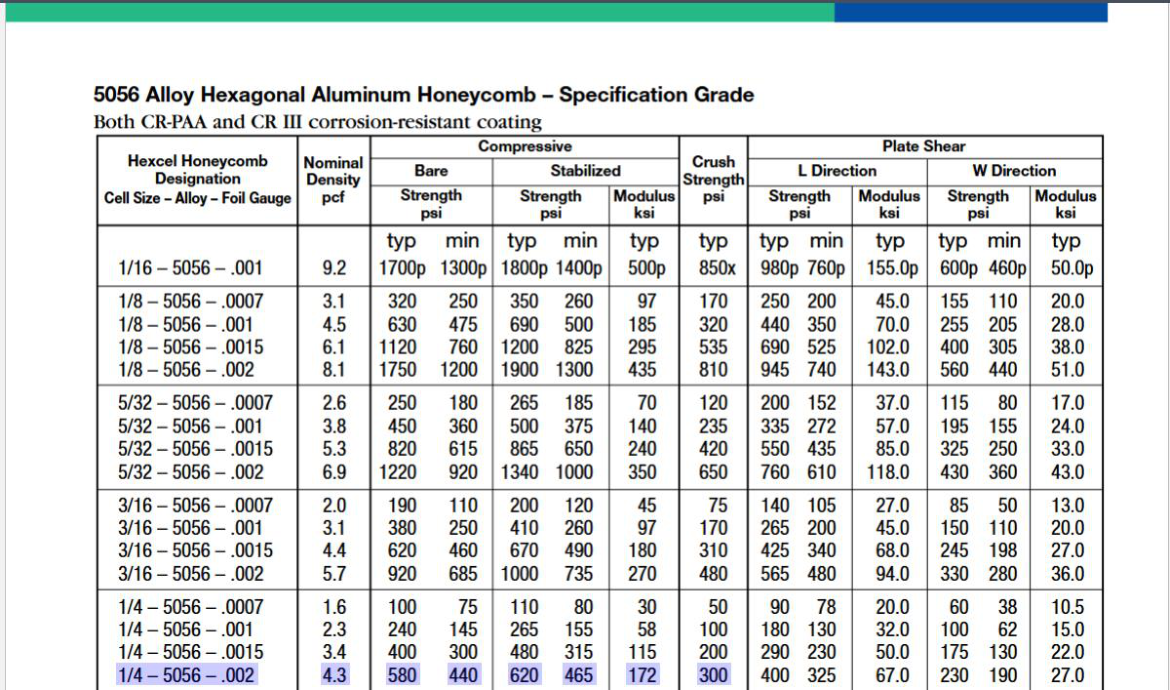
- σpeak = 4.5 MPa (653 psi) and σcrush = 1.87 MPa (270 psi) — close to manufacturer specifications of 620 psi peak and 300 psi crush for the target 5056 alloy at 4.3 pcf density.
- Energy absorbed ≈ 798.9 MPa·cm³ over the full crush stroke, computed from the area under the stress-strain curve multiplied by specimen volume (492.8 cm³).
- Specimen density was 4.6 pcf and cell size 6.11 mm, identifying it as most likely a 5056 Alloy Hexagonal Aluminum Honeycomb, designation ¼-5056-0.002.
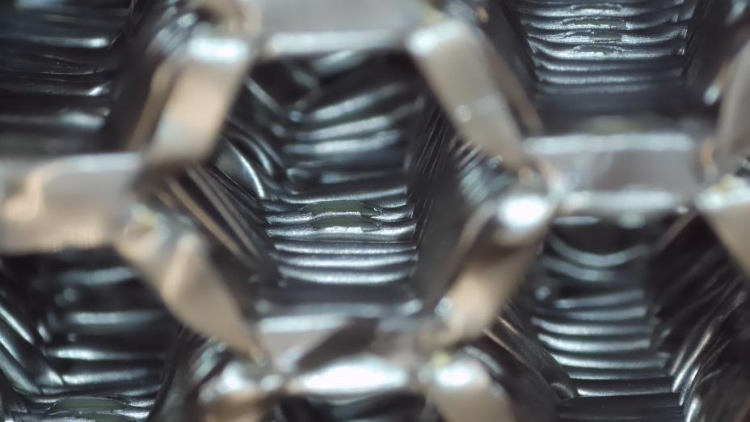
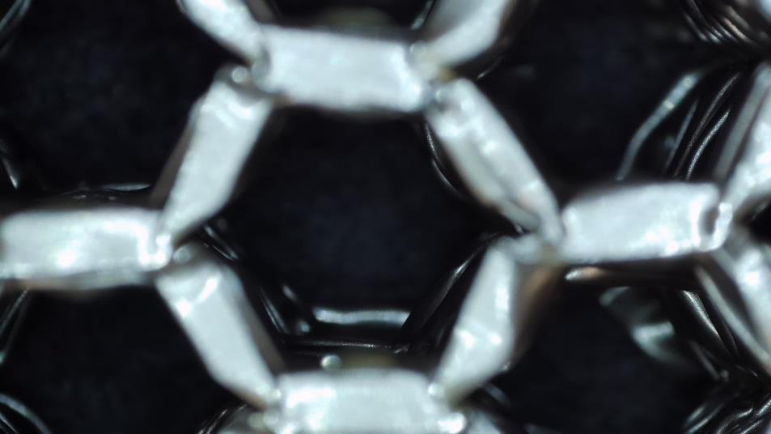
- Microscopy confirmed progressive cell-wall local buckling and folding consistent with the expected energy absorption mechanism. Even as sections failed, buckled walls reinforced adjacent sections, explaining the near-constant plateau force.
Microscopy Findings
- Close-up views showed bent and buckled cell walls with periodic fold lines — the characteristic signature of progressive axial crushing in thin-walled metallic structures.
- Top-view images revealed collapsed hexagonal geometry, with cell walls folded inward against adjacent cells rather than fracturing, confirming ductile deformation consistent with aluminum alloy behavior.
- The progressive failure mechanism — each buckled section strengthening its neighbor — physically explains the near-constant plateau force and high specific energy absorption that make honeycomb cores so valuable in crash structures.
Valuable Takeaways
- Energy absorption is what makes honeycomb cores irreplaceable in crash structures. The flat plateau on the stress-strain curve represents sustained, controllable energy absorption over a long stroke — exactly what is needed in aircraft floor panels, helicopter seats, and automotive crumple zones.
- The three-stage crush curve is a design tool. Engineers select honeycomb density and cell size to place σcrush at the right level for a specific load case, keeping loads below what occupants or equipment can tolerate while maximizing energy absorption.
- Standardized testing (ASTM D 7336) ensures reproducibility. Following the standard procedure — specimen selection, pre-load, test method — made results directly comparable to manufacturer data, demonstrating the importance of protocol adherence in structural materials testing.
- Gained hands-on experience with a universal testing machine, structured specimen selection from multi-team data, and materials microscopy — all standard methods in aerospace structural qualification programs.